3.1 - Radar signatures of linear dunes and mega-yardangs
Eight representative locations were selected in the Great Sand Sea and six in the Namib Desert, in order to derive a typical radar scattering profile for Egyptian and Namibian dunes. We applied a standard calibration procedure to full resolution TerraSAR-X data to compute the backscattered radar power at each pixel (Schwerdt et al., 2010). We averaged pixels values in the direction parallel to the main orientation of the structures, in order to get a better representation of typical variations of the radar scattering across the studied structures: averaging was performed using a median estimator, so that extreme high returns due to natural corner reflectors and extreme low returns at the noise floor level (around −28 dB for TerraSAR-X) did not bias the average value. Fig. 3 shows two typical radar signatures across Egyptian and Namibian linear dunes. Egyptian dunes present three main levels of radar scattering (Fig. 3, left): a radar-bright interdune (around −15 dB) due to an exposed rough bedrock (Besler, 2008), a medium scattering level for the dune’s side facing the radar illumination (front side, around −23 dB), and a low scattering level for the dune’s side opposite to the radar illumination (back side, −30 dB and lower). Namibian dunes present a different, rather bimodal, radar signature, with a less radar-bright interdune due to a smooth sand cover (Bristow et al., 2000). Fig. 3 (right) shows a typical radar profile across a Namibian dune, where two main scattering levels can be observed: a strong radar return on the side of the dune facing the radar, can reach −10 dB (due to a lower incidence angle combined with smaller-scale structures superposed to the main dune’s shape (Lancaster, 1989). A lower scattering level, in the −25 to −30 dB range, corresponds to returns from both interdune and back side of the dune (the latter likely mixing with the interdune return when decreasing the radar image resolution). This shows that, while both dune systems in Egypt and Namibia are of the same linear type, their radar signature can be quite different due to different interdune properties. This appears quite obvious here from high-resolution radar images, but at the lower resolution (and higher noise level) of the Cassini RADAR instrument, observing these structures can become more confusing.
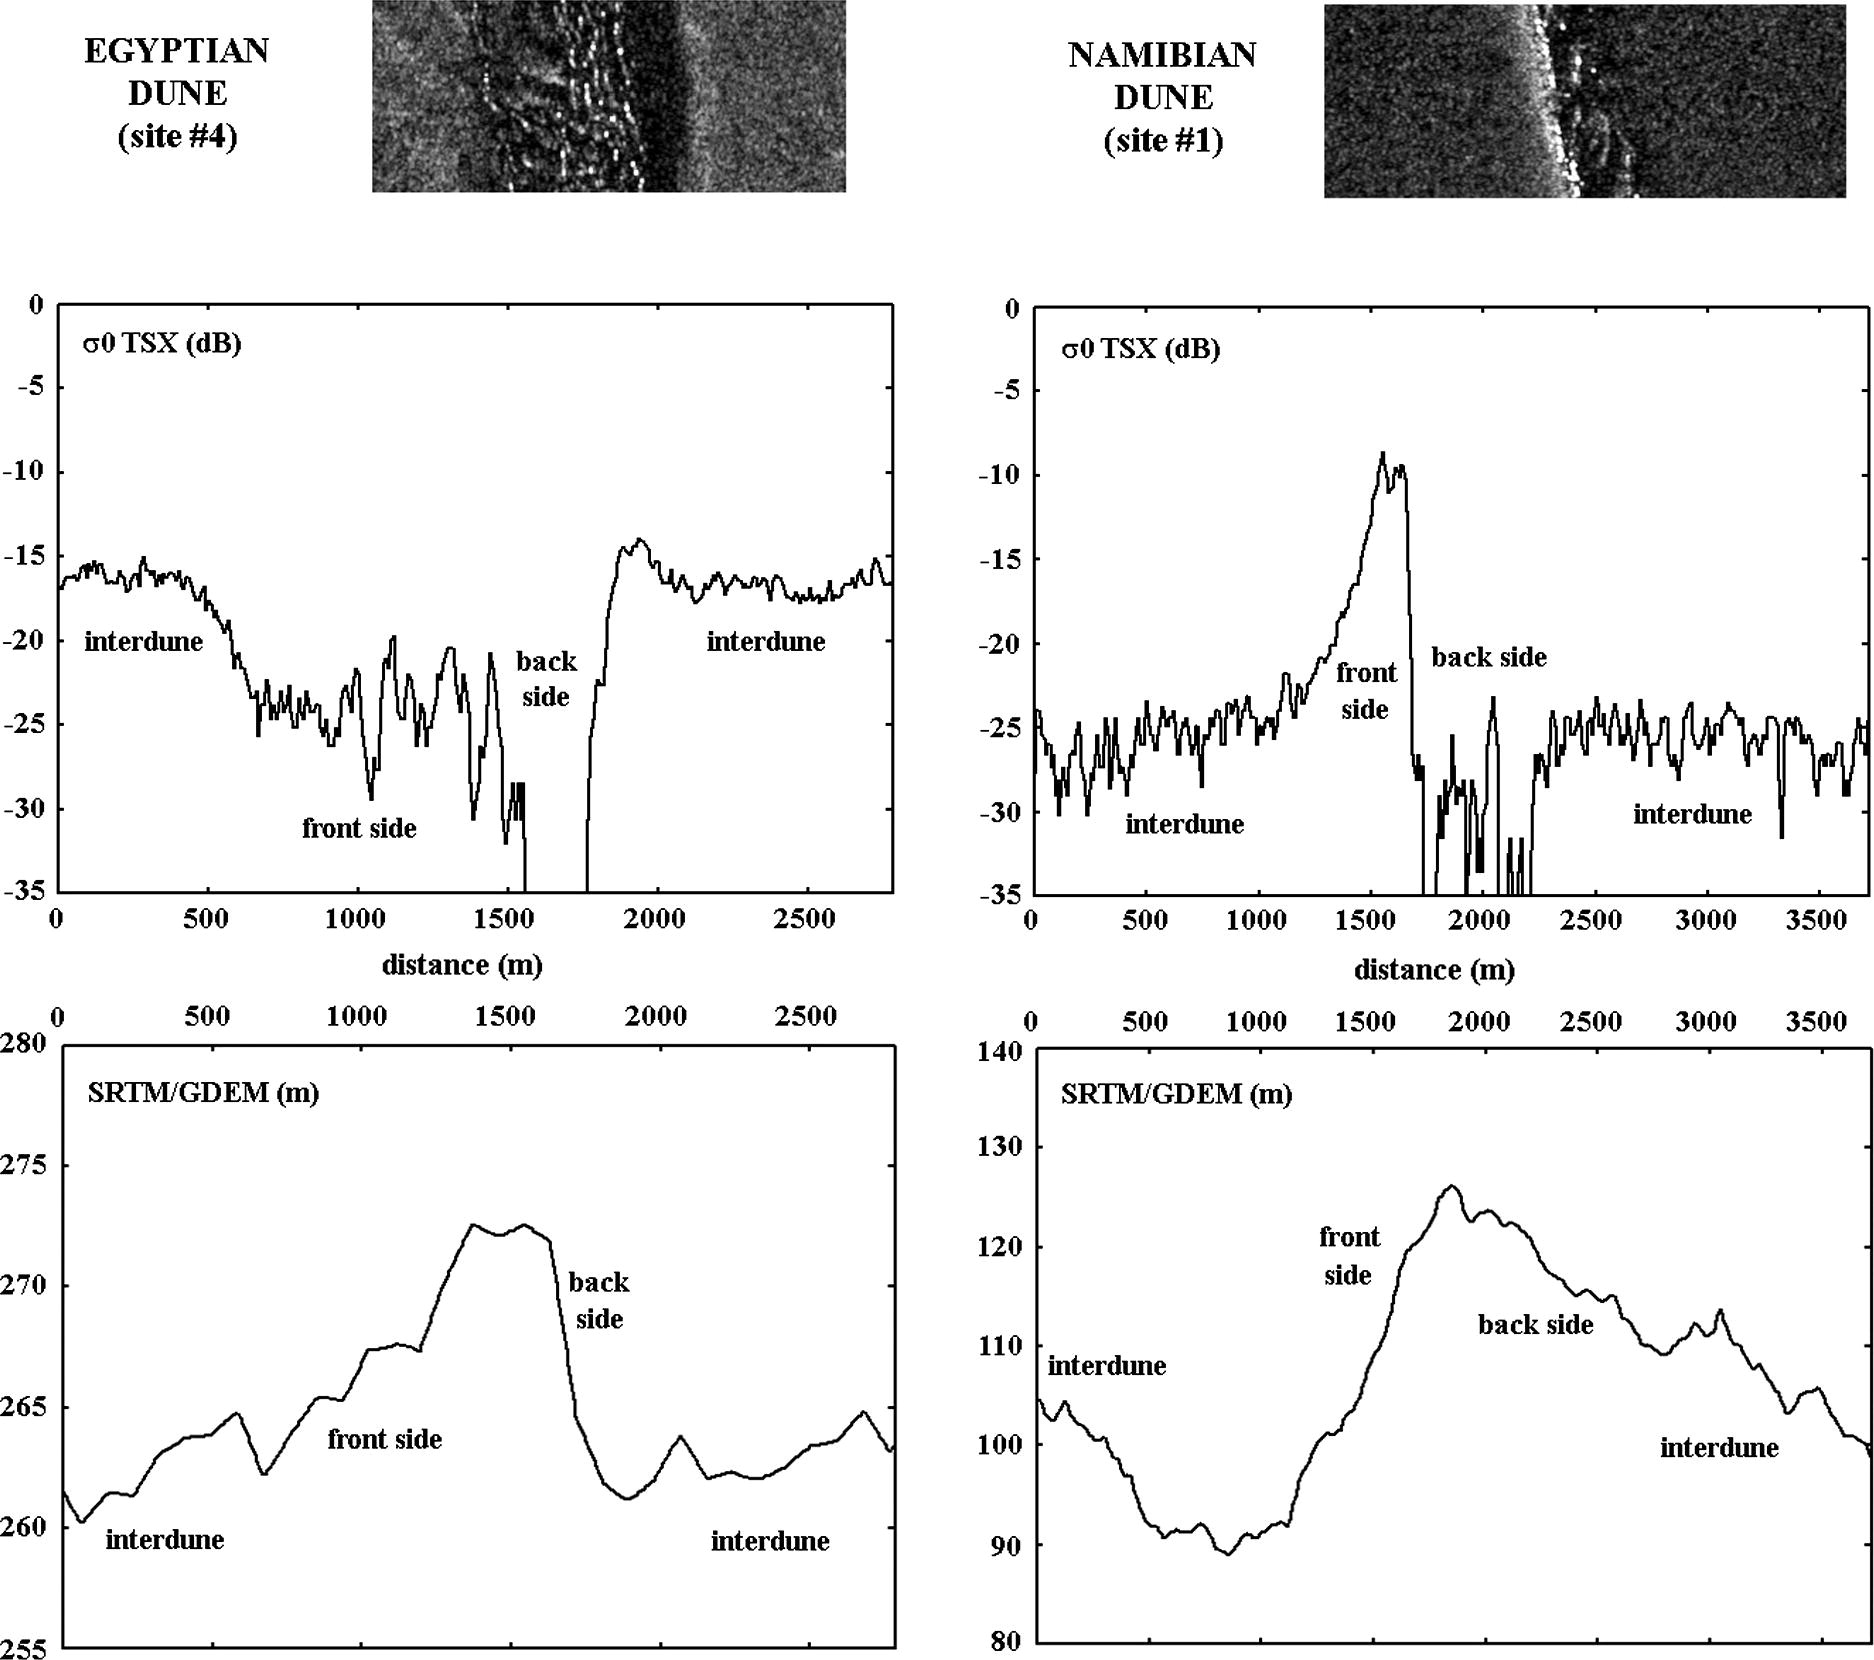 Figure 3: TerraSAR-X radar scattering and topography (SRTM with voids filled using GDEM) profiles across a linear dune of the Great Sand Sea in Egypt (left) and of the Namib Desert in Namibia (right). The analysed full resolution TerraSAR-X extracts are shown on top of the figure (site #4 for the Egyptian dune, at incidence angle of 23º, and site #1 for the Namibian dune, at incidence angle of 29.2º), north is up and radar illumination is from the left. Vertical axis of plots is backscattered power (in dB) or altitude (in m) while horizontal axis is the distance across the dunes (in m). Location of interdune, front side and back side of the dunes are indicated on each plot.
Regarding mega-yardangs, we studied five representative locations in the Lut Desert and also five in the Borkou Desert, to derive typical radar profiles for young and older mega-yardangs. As before, we averaged the pixel values in the direction parallel to the main orientation of the structures using a median estimator. Fig. 4 presents two typical radar signatures across Iranian and Chadian yardangs. The young mega-yardangs in Iran (Fig. 4, left) show a high spatial frequency alternation of the high scattering level from the rough crests of the eroded layer (>−10 dB) and the medium-scattering level from narrow and shallow valleys (around −15 dB). This alternation is cut in places by regions of low radar return (<−25 dB), due to deeper eroded valleys filled with smooth aeolian deposits (Gabriel, 1938). The older mega-yardangs in Chad present a different, more bimodal radar signature (Fig. 4, right), with alternation of radar-bright level from wider and flatter crests (around −10 dB, less radar-bright than the Iranian ones likely because a longer period of erosion produced a smoother surface), and low-scattering level due to larger erosion valleys (<−25 dB), which are likely to be filled with aeolian sand deposits. As for linear dunes, the two mega-yardangs structures, of different age and created in different types of rocks, exhibit differences in their radar signature. However, it is apparent that mega-yardangs in general are more radar-bright than linear dunes, since we observe about 10 dB difference in the average backscattered power. This is likely due to the strong radar return of the rougher and wider yardangs’ crests, compared with a lower overall signal returned by the smoother sandy surfaces of dunes.
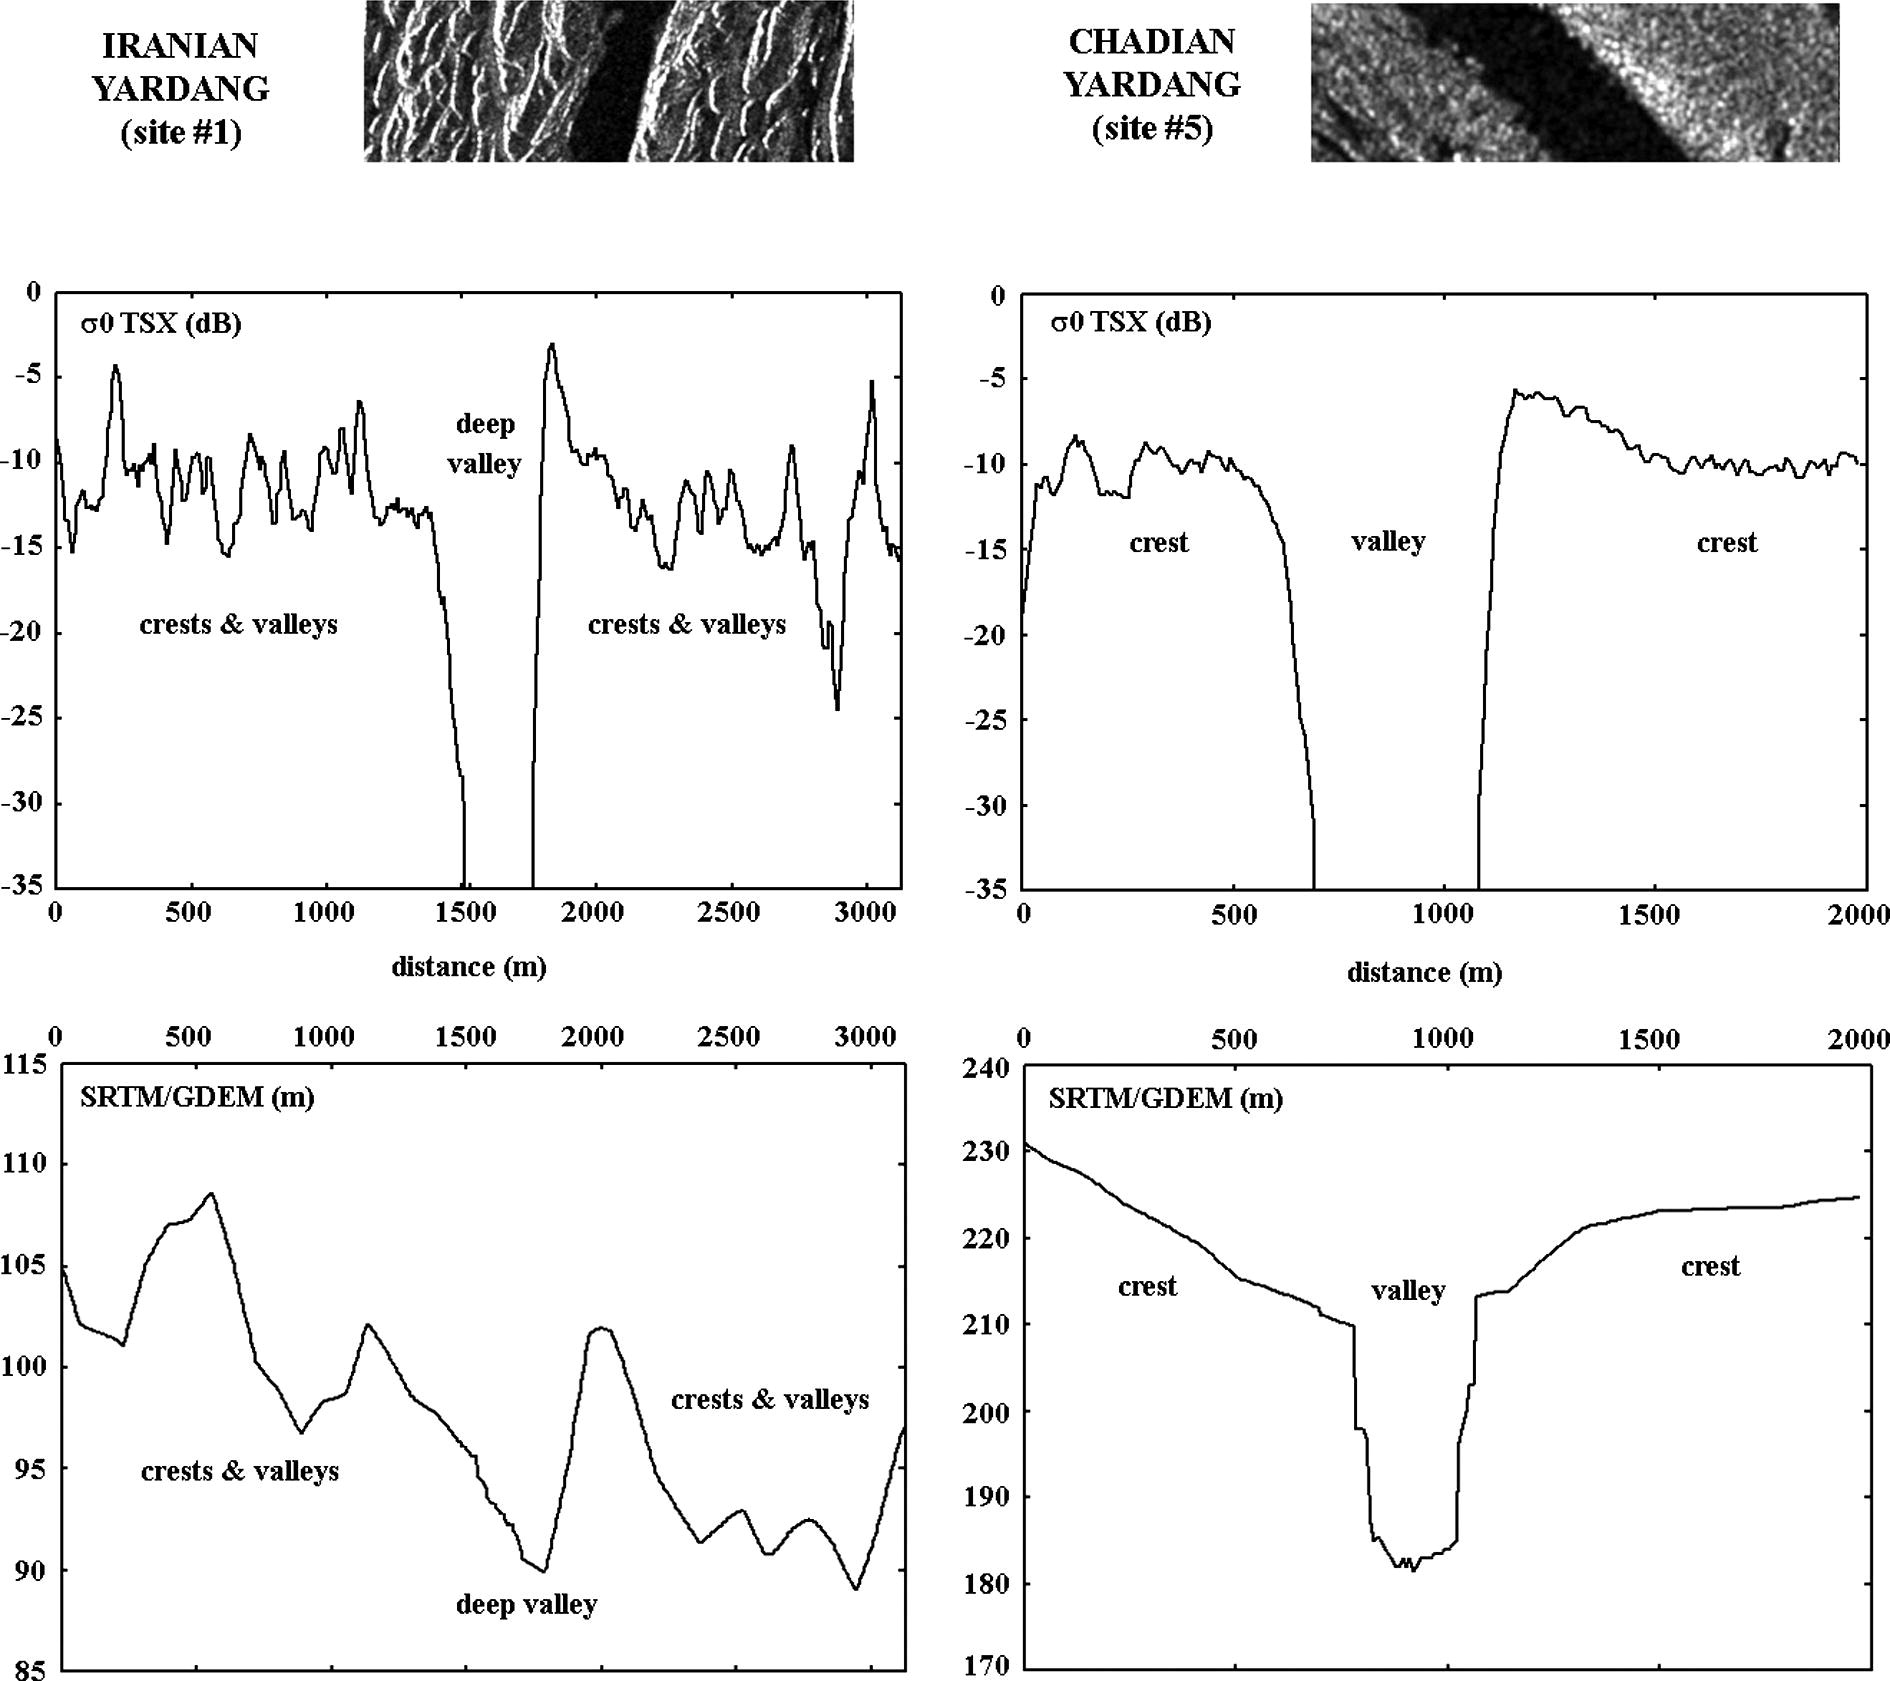 Figure 4: TerraSAR-X radar scattering and topography (SRTM with voids filled using GDEM) profiles across mega-yardangs of the Lut Desert in Iran (left) and of the Borkou Desert in Chad (right). The analysed full resolution TerraSAR-X extracts are shown on top of the figure (site #1 for Iranian yardangs, at incidence angle of 33.6º, and site #5 for Chadian yardangs, at incidence angle of 33.5º), north is up and radar illumination is from the left. Vertical axis of plots is backscattered power (in dB) or altitude (in m) while horizontal axis is the distance across the yardangs (in m). Location of valleys and crests are indicated on each plot.